By: Jabria Roscoe
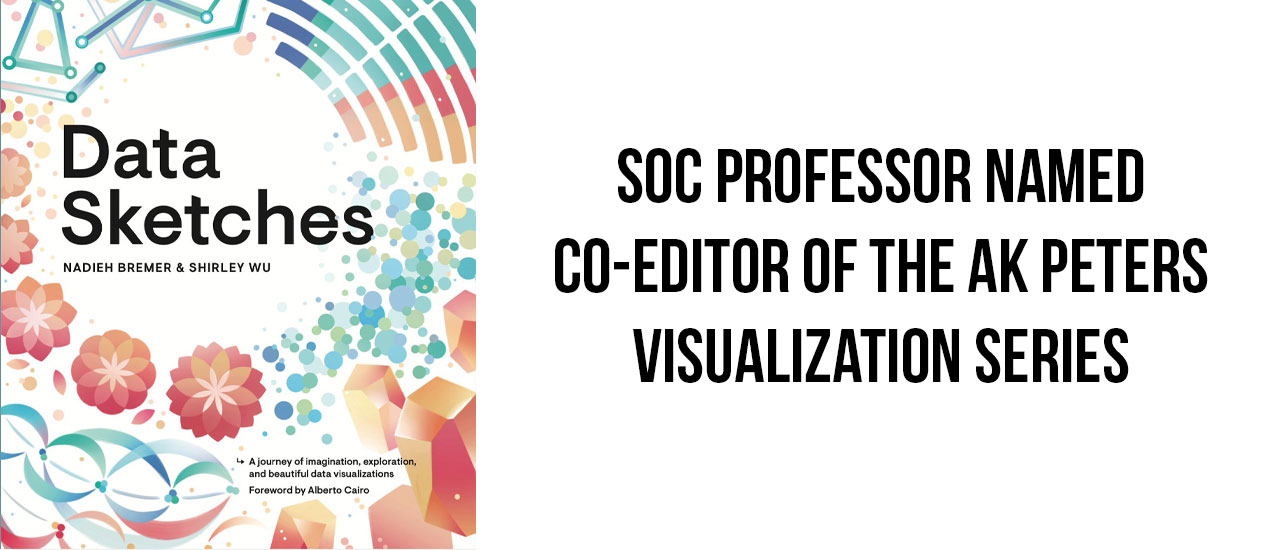
School of Communication associate professor and world-renowned data journalist, Alberto Cairo, was named co-editor of the AK Peters Visualization Series. The series is a collection of books that aims to explain the subject of data visualization.
Cairo will work alongside University of British Columbia professor, Tamara Munzner, to find new authors to create books that cater to the world of data journalism.
“I got interested in the role because I knew Tamara was involved. She is highly respected in the field, so when I got asked to be the editor…that was one of the selling points for me,” Cairo said.
“Being an editor in a series like this means that you work as a mentor,” Cairo explains. “I have a list of 10 or 15 people who I feel should be writing books. People who are qualified to write professional books about visualization have a duty to give back to the community, I believe.”
In recent years, Cairo has noticed that the general interest for data visualization is increasing. Last year, The Washington Post shared that out of the seven most popular stories ever published on its website, six had been produced by their graphics department, which is in charge of all infographics and data visualizations.
“Journalism isn’t the only discipline where interest in visualization is growing,” Cairo says, “it’s happening everywhere: in the sciences, in statistics, in business analytics, and many others.”
This interest is what lead to the publishing company, CRC Press, to create the AK Peters Visualization Series.
“I would like to focus on facilitating other people’s writing,” said Cairo, “working as a mentor of younger people who are doing wonderful things—and who, in many cases, know much more than I do about visualization,”
Cairo says he hopes he can use his time at AK Peters to give a voice to other data journalists, visualization designers, data scientists, and statisticians.
“I’d like visualization as a professional and academic field to be more diverse,” said Cairo. “Right now, many of the most quoted books in the visualization literature were written by people who work in the United States or the United Kingdom. I’d like to talk to people who are doing data in the Middle East, in Africa, in Asia—and to have them write about their own experience, values, goals, and perspectives. That will greatly enrich the field in the future.”


